
Pivot Chart in Excel: Explained
In this article, you will learn how to create and use pivot charts in Excel.
What does the Pivot Chart do in Excel?
The pivot chart functionality in Excel allows you to create interactive visual representations (charts and graphs) of your pivot table data. It combines the capabilities of pivot tables and charts, enabling you to analyze and present data in a dynamic and visually appealing manner.
What are some uses of Pivot Charts in Excel?
Here's an overview of some applications of the PivotChart functionality in Excel:
- PivotTable Integration: PivotCharts are closely integrated with PivotTables. You can quickly create a PivotChart based on an existing PivotTable or create both simultaneously. Any changes made to the underlying PivotTable are automatically reflected in the PivotChart, providing real-time updates. They enable you to analyze and explore large datasets in various ways. You can easily aggregate, filter, and compare data using different chart types such as bar charts, line charts, pie charts, and more.
- Data Slicing: With PivotCharts, you can slice and dice data to view different dimensions or perspectives of the data. You can use slicers, which are interactive visual filters, to easily segment the data based on specific criteria, categories, or time periods.
- Chart Formatting and Customization: PivotCharts provide a range of formatting and customization options. You can adjust chart elements, such as titles, axes, legends, and colors, to enhance readability and visual appeal. Additionally, you can apply various chart layouts, styles, and themes to match your desired presentation style.
- Presentation and Reporting: PivotCharts are effective for presenting data insights and sharing reports with others. You can export or copy PivotCharts to other Office applications like PowerPoint or Word, embed them in documents or presentations, or simply print them for physical distribution.
- Dynamic Updates: As the underlying data in the PivotTable changes or expands, the PivotChart can be easily refreshed to reflect the updated information. This feature is particularly useful when dealing with dynamic datasets or when the source data is frequently updated.
Overall, the PivotChart functionality in Excel empowers users to explore, analyze, and visualize data in a more dynamic and interactive manner. It facilitates data-driven decision-making by presenting complex information in a clear and concise format, enabling users to uncover patterns, trends, and relationships within their data.
How to use Pivot Charts in Excel?
To use PivotCharts in Excel, follow these steps:
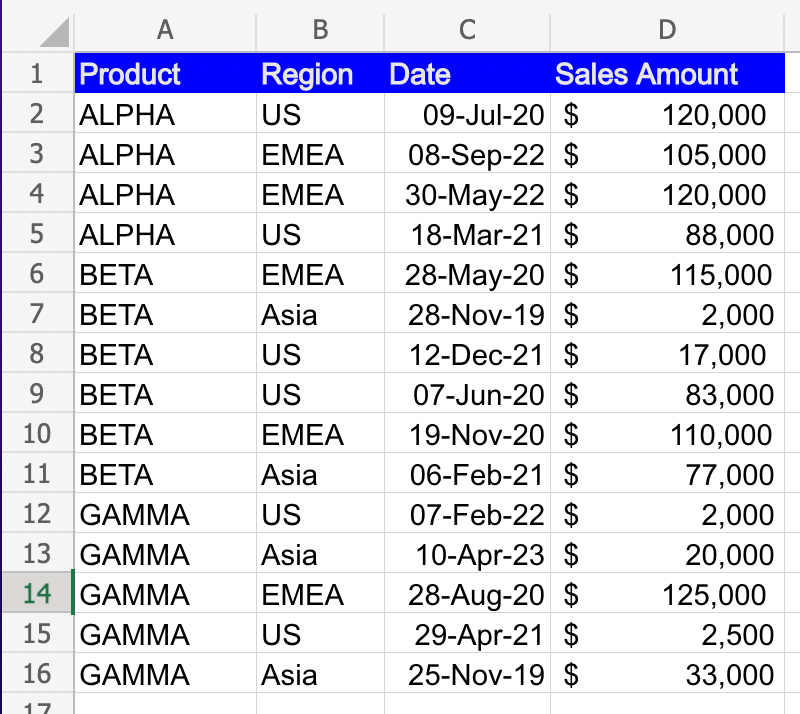
Step 1: Organize Your Data: Ensure that your data is organized in a tabular format with column headers. Each column should represent a specific data category, and each row should contain data entries.
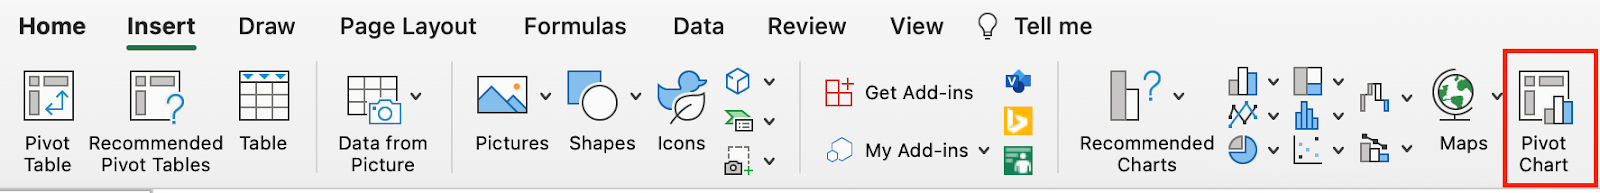
Step 2: Create a PivotChart: With the PivotTable selected, go to the "Insert" tab in the Excel ribbon and click on "PivotChart."
Step 3: Customize the PivotChart: After creating the PivotChart, you can customize it to suit your needs. Right-click on any element of the chart (e.g., axes, titles, data points) to access formatting options. Use the "Chart Tools" section in the Excel ribbon to further customize the chart's appearance, including titles, labels, colors, and chart styles.
Step 4: Refresh the PivotChart: If the underlying data in the PivotTable changes, you can refresh the PivotChart to reflect the updates. Right-click on the PivotTable or PivotChart and choose "Refresh" to update the chart with the latest data.
By following these steps, you can effectively create, customize, and interact with PivotCharts in Excel to analyze and visualize your data.


