
PERCENTILE Function in Google Sheets: Explained
In this article, you will learn how to use the PERCENTILE function in Google Sheets.
Percentiles are instrumental in calculating the relative standing of a particular data point within a dataset, providing insights into your data's spread and distribution.
What is a Percentile?
A percentile is a statistical metric that helps us grasp the position of a data point within a dataset. It represents the percentage of values below or equal to a given value. Here are a few key percentiles:
P25 (25th Percentile): Marks the point where 25% of the data falls below.
P50 (50th Percentile): Commonly known as the median, this is the midpoint of the data, with 50% below and 50% above.
P75 (75th Percentile): Indicates the point where 75% of the data is covered.
Understanding percentiles allows you to evaluate the distribution of data and identify its relative position within a range. It's noteworthy that you can calculate any desired percentile, such as the 10th, 80th, 95th, and so on.
How to Use the PERCENTILE Function in Google Sheets
- Type the Formula: In the cell where you want the result, type “=PERCENTILE” or go to the menu bar and navigate to "Insert" ➝ "Function" ➝ "Statistical" ➝ "PERCENTILE."
- Select the Data: Choose the range of cells containing the dataset for which you want to calculate the percentile. If your data is not next to each other, use commas to show different ranges, ensuring your formula considers all the data points.
- Enter the Desired Percentile: After selecting the data, specify the desired percentile by entering a percentage value. For example, to find the 25th percentile, enter 25%.
- Press "Enter": Execute the formula by pressing the "Enter" key.
The PERCENTILE formula is structured as follows:
Data: The range of data for percentile calculation.
Percentile: The desired percentile (e.g., 25% for P25, 50% for P50).
Let’s see some examples. Consider you have a dataset of revenue per client for a given month:
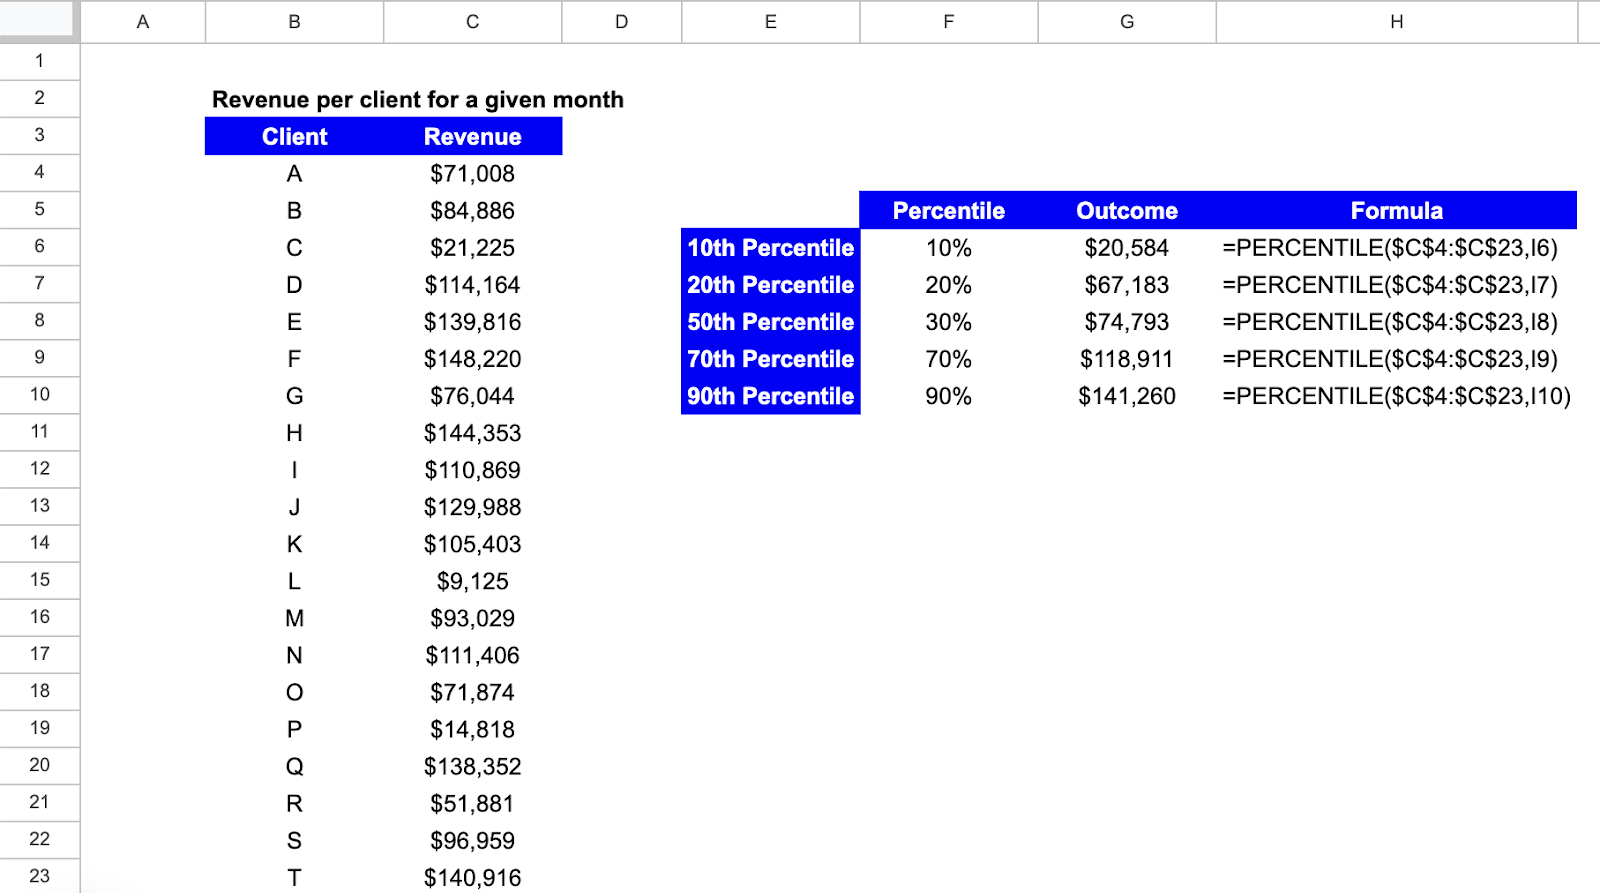
- 10th Percentile
The resulting value is visible in cell G6, and the formula in H6. To calculate the 10th percentile, you select the entire dataset and either input the percentile value of 10%, or use a cell reference, in this case F6 which has the value of 10%. This allows you to quickly and easily change the parameter by changing the referenced cell.
This provides insight into the lower-performing segment clients — those with revenues below the 10th percentile.
- 20th Percentile
For the 20th percentile, G7 has the output value and H7 the formula. To calculate the 20th percentile, you select the entire dataset and input the percentile value of 20%, or use a cell reference, which is F7 in this case.
This provides insight into the performing segment of clients with revenues below the 20th percentile.
- 50th Percentile
For the 50th percentile, equivalent to the Median, G8 has the output value and H8 the formula. To calculate the 20th percentile, you select the entire dataset and input the percentile value of 50%, or use a cell reference, which is F8 in this case.
This represents the middle point of the revenues, where half of the clients have revenues below and half have revenues above.
- 70th Percentile
For the 70th percentile, G9 has the output value and H9 the formula. To calculate the 70th percentile, you select the entire dataset and input the percentile value of 70%, or use a cell reference, which is F9 in this case.
This identifies the higher-performing segment of clients — those with revenues above the 70th percentile.
- 90th Percentile
Finally, for the 90th percentile, G10 has the output value and H10 the formula. To calculate the 90th percentile, you select the entire dataset and input the percentile value of 90%, or use a cell reference, which is F10 in this case.
This identifies the higher-performing segment of clients — those with revenues above the 90th percentile.
What are PERCENTILE.INC and PERCENTILE.EXC Functions
The PERCENTILE.INC function in Google Sheets calculates percentiles inclusively, considering the specified percentage in the calculation. Conversely, the PERCENTILE.EXC function uses an exclusive method, excluding the specified percentage from the calculation.
These functions offer flexibility when analyzing data distribution, allowing you to choose whether to include or exclude the specified percentile value in your calculations.


