
How to Use the QUARTILE Function in Google Sheets
In this article, you will learn how to use the QUARTILE function in Google Sheets.
This function is particularly useful when you want to analyze the distribution of data by dividing it into quartiles. Quartiles help identify the spread and central tendency of your dataset.
What is a Quartile?
A quartile is a statistical term that helps us understand how data is spread out. It divides a dataset into four equal parts, each representing a quarter (25%) of the data. There are three main quartiles:
- Q1 (First Quartile): This marks the beginning of the dataset, representing the first 25% of the data.
- Q2 (Second Quartile): Also known as the median, this is in the middle of the data, marking the first 50%.
- Q3 (Third Quartile): This marks the point where we've covered the first 75% of the data.
Understanding quartiles is like slicing a dataset into four equal pieces, helping us see how data is distributed from start to finish.
How to Use the QUARTILE Function in Google Sheets
- Type the Formula: In the cell where you want the result, type “=QUARTILE” or go to the menu bar and Navigate to "Insert" ➝ "Function" ➝ "Statistical" ➝ "QUARTILE."
- Select the Data: Choose the range of cells containing the dataset for which you want to calculate the quartile. If some of your data is not right next to each other, use commas to show where each set of data begins and ends. This helps indicate that there are different ranges and ensures that your formula takes into account all the data points you want to include in your calculation.
- Press "Enter": After selecting the data, press the "Enter" key to execute the formula.
The QUARTILE formula is as follows:
Data: The range of data for which you want to calculate the quartile.
Quartile_number: Which of the 3 quartiles you want to return.
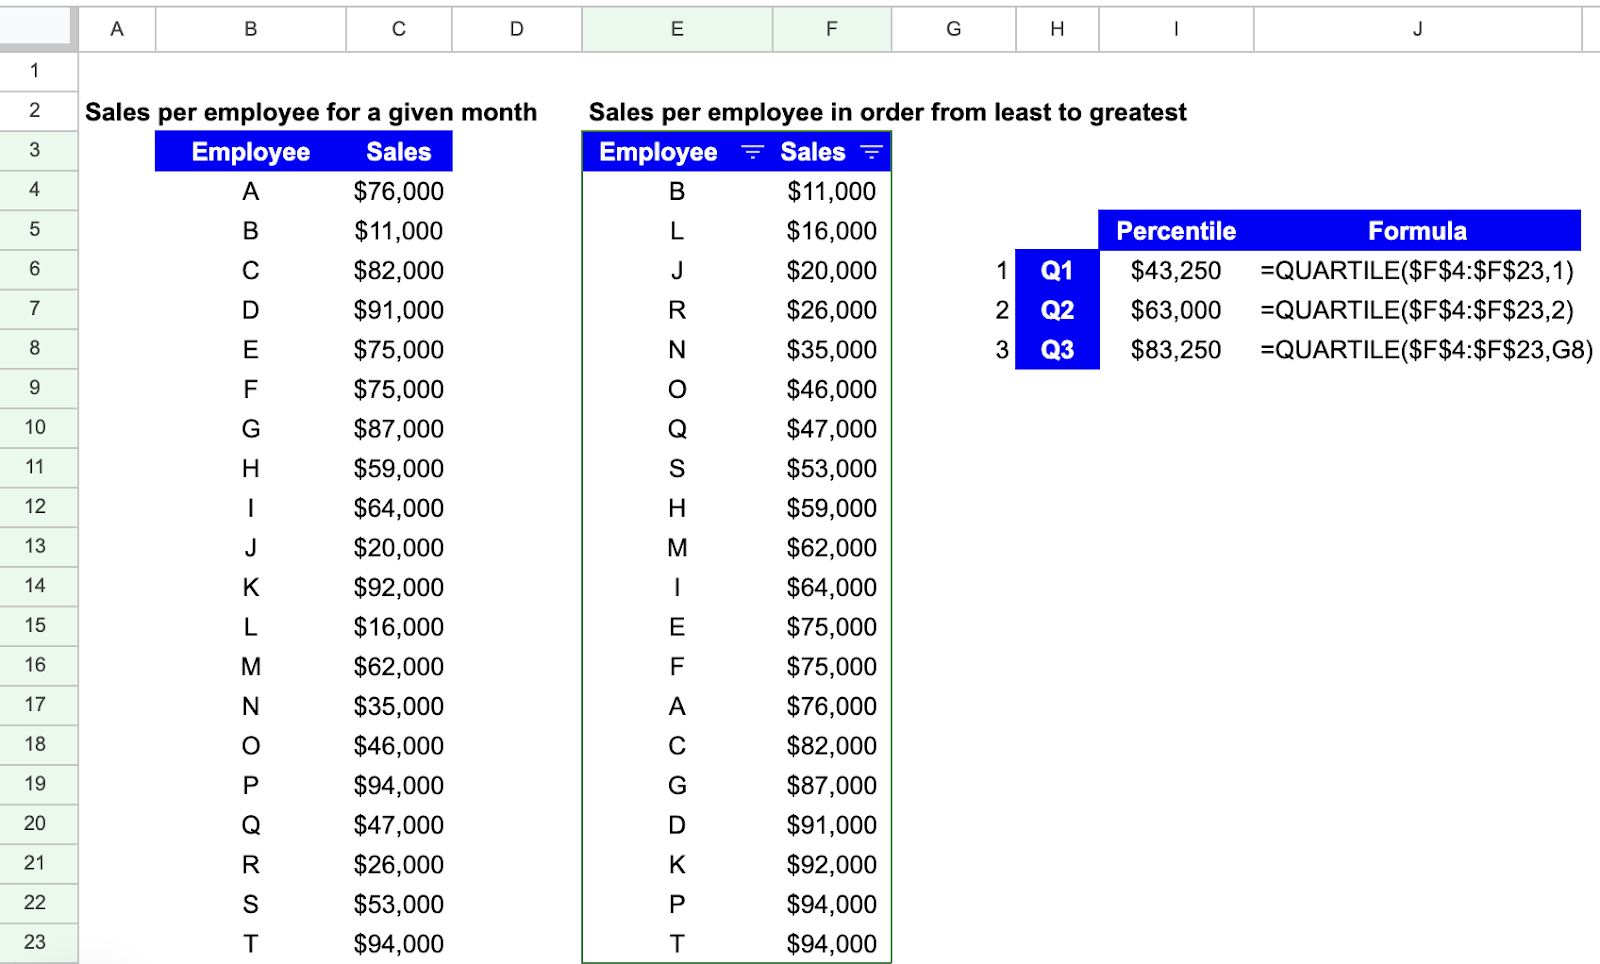
Let’s see some examples. Imagine your company has 20 sales representatives and you want to analyze their sales for a given month:
To calculate each of the quartiles, you will do the following:
- First Quartile (Q1)
The resulting value is visible in cell I6, and the formula in J6. You select the entire range of data and then the number 1 to mark the first quartile.
The data returns the first quartile as $43,250. This gives us insight into the lower-performing segment of employees i.e. Employees with sales below $43,250 are in the first quartile.
- Second Quartile (Q2)'
As before, the process repeats. The resulting value is visible in cell I7, and the formula in J7. You select the entire range of data and then the number 2 to mark the second quartile.
This is the median, representing the middle point of sales performance. Half of the employees have sales below $63,000, and half have sales above.
- Third Quartile (Q3)
Repeat the process one last time. The resulting value is visible in cell I8, and the formula in J8. You select the entire range of data and then the number 3 to mark the third quartile. One other way to do this is shown in the formula of cell J8.
Instead of typing the number 3 directly into the formula, you can also use a cell reference (in this case cell G8 that has the number 3). This allows you to quickly and easily change the parameter by changing the referenced cell.
The resulting value for the third quartile (Q3) provides insight into the higher-performing segment of employees. Employees with sales above $83,250 are in the third quartile.
What are the QUARTILE.INC and QUARTILE.EXC Functions
The QUARTILE.INC function in Google Sheets calculates quartiles based on an inclusive method, including the median in the calculation.
On the other hand, the QUARTILE.EXC function uses an exclusive method, excluding the median from the calculation.
These functions are helpful when you want to analyze the distribution of data in different ways, considering or excluding the median value in quartile calculations.


