
Predicting Future Data with Linear Forecasting Functions in Excel
In this article, you will learn how to predict future data using the FORECAST and FORECAST.LINEAR functions in Excel.
What are the FORECAST and FORECAST.LINEAR functions in Excel?
The FORECAST and FORECAST.LINEAR functions are both statistical functions that allows you to predict future values based on existing (historical) values. It should be noted that the FORECAST function has been replaced by the FORECAST.LINEAR function, however, is still compatible with some versions of Excel. With that said, both functions use linear regression to find the best-fitting line through the known x-values and known y-values, and then uses this linear model to predict the y-value for a given new x-value.
When is it helpful to use the FORECAST and FORECAST.LINEAR functions in Excel?
The FORECAST and FORECAST.LINEAR functions in Excel are helpful in various scenarios where you need to make predictions based on historical data. These functions use linear regression, so they are best suited for datasets that have a linear relationship between the dependent and independent variables. Here are some scenarios where these functions can be particularly helpful:
- Sales Forecasting: If your sales have been steadily increasing or decreasing over time, you can use these functions to predict future sales based on historical sales data.
- Budget Planning: In business, these functions can be used for budgetary planning by estimating future expenses, revenues, or other financial metrics based on historical trends.
How to use the FORECAST and FORECAST.LINEAR functions in Excel
Since the FORECAST.LINEAR function replaces the FORECAST function they have the same syntax, so it is easy to learn both functions once you learn one.
The syntax for the FORECAST function is the following:
The syntax for the STDEV.S function is the following:
X: This is a required argument which is the data point which you want to predict a y-value for.
Known_y’s: This is a required argument that is the array of dependent y-vaues that are already known.
Known_x’s: This is a required argument that is the array of independent x-values that are already known.
Suppose you have the monthly sales data for a product and you noticed that the sales are growing linearly the past 6 months and you want to predict the sales for the next 6 months. You can do this by using the FORECAST or FORECAST.LINEAR function.
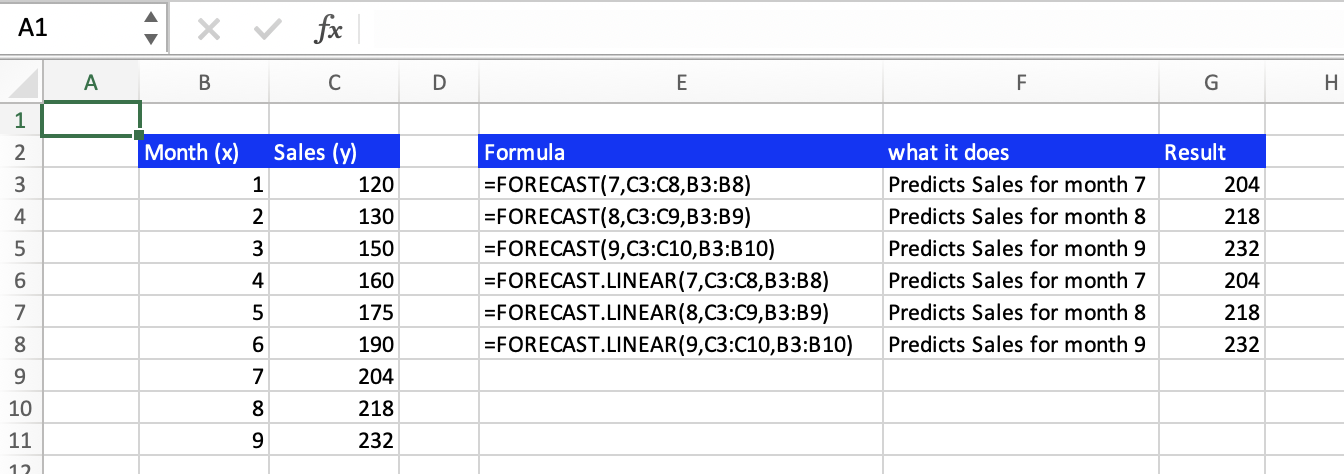
Let's take a look at the first formula in cell E3. This formula tells Excel to predict the sales (y) for month 7 (the x argument being 7), based on the historical sales data in the range C3:C8 (the known_y’s argument) and the corresponding months in the range B3:B8 (the known_x’s argument). With that the FORECAST function will return 204 as the predicted amount of sales in the 7th month. And as seen in the image above, the FORECAST function and the FORECAST.LINEAR function return the same value.
Note of Caution: The predictions made by the FORECAST and FORECAST.LINEAR functions are based on a linear trend. If there are other factors influencing sales that are not linear or if there is seasonality, this prediction may not be very accurate. Also, the FORECAST function may not capture sudden changes or events that were not present in the historical data.
What is the difference between the linear forecasting functions and the ETS forecasting functions?
Our linear forecasting functions include the ones discussed in this article, the FORECAST function and the FORECAST.LINEAR function. These functions predict based on a linear trend which does not take into account nonlinear growth or decline, seasonality, etc. The ETS forecasting functions include the FORECAST.ETS, FORECAST.ETS.SEASONALITY, FORECAST.ETS.CONFINT, and FORECAST.ETS.STAT. These ETS (Exponential Triple Smoothing) functions makeup for the disadvantages of the linear functions and can predict value for non-linear data, take seasonality into account, etc. This also means the syntax is different for the ETS functions. What forecasting function to use is up to the user, the relationship between their variables, and what information they want out of the function.
Go to the page LiveFlow‘s How to Guides to find more information about Excel and Google Sheets formulas and tips that were not covered here.


