
FREQUENCY Function in Excel: Explained
In this article, you will learn how to use the FREQUENCY formula in Excel.
What does the FREQUENCY formula do in Excel?
The FREQUENCY function in Excel is used to calculate the frequency distribution of values in a dataset. It returns an array of values representing the number of occurrences of each value within specified bins or intervals. It is useful for analyzing the distribution of data across different intervals or categories. It allows you to understand the frequency of occurrences for specific ranges of values, which can be valuable for data analysis, histogram generation, and statistical calculations.
What are some uses of the FREQUENCY function in Excel?
The FREQUENCY function in Excel has several practical uses. Its ability to calculate the frequency distribution of values provides valuable insights for data analysis, statistical calculations, quality control, market research, and resource planning in various fields.
Here are a few examples:
- Histogram Generation: The primary use of the FREQUENCY function is to generate histograms or frequency distributions. By using the FREQUENCY function, you can calculate the number of occurrences of values within specified bins or intervals. This helps in visualizing the distribution of data and identifying patterns or outliers. The FREQUENCY function is often used in conjunction with other statistical functions in Excel. You can combine it with functions like AVERAGE, MEDIAN, MODE, and STANDARD DEVIATION to perform advanced data analysis.
- Quality Control: In quality control processes, the FREQUENCY function can be used to analyze defects or errors across different categories. By categorizing defects into bins based on severity or type, you can determine the frequency of occurrence for each category. This helps identify areas that require improvement or targeted interventions.
- Market Research: The FREQUENCY function can be applied in market research to analyze survey responses or customer feedback. By categorizing responses into bins, you can determine the distribution of opinions or ratings for different attributes or variables. This aids in understanding customer preferences, identifying trends, or segmenting the market.
- Resource Planning: In resource planning or capacity management, the FREQUENCY function can help analyze the utilization of resources over time. By dividing time periods into intervals, you can determine the frequency of resource utilization within each interval. This information assists in identifying peak demand periods, resource allocation, and capacity optimization.
- Data Validation: The FREQUENCY function can also be used as a data validation tool. By comparing the frequencies of values across different categories or intervals, you can identify anomalies, outliers, or missing values that require further investigation or correction.
How to use the FREQUENCY function in Excel?
The syntax of the FREQUENCY formula in Excel is as follows:
"Data_array" is the array or range of values for which you want to calculate the frequency distribution.
"Bins_array" is an array or range of values that defines the intervals or bins into which the data values will be categorized.
Here's how you can use the FREQUENCY function in Excel:
Step 1: Prepare your data: Arrange your data in a single column or row. This column or row contains the values for which you want to calculate the frequency distribution.
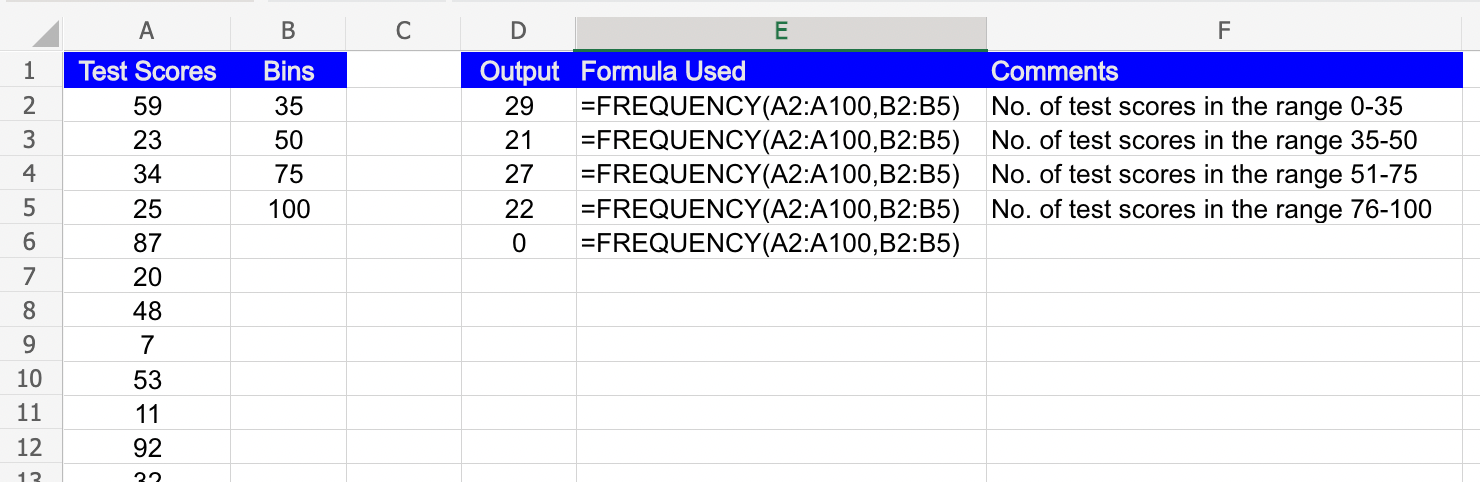
Step 2: Define bins or intervals: Decide on the intervals or bins you want to use to categorize the data. For example, if you have a range of test scores, you might define bins such as 0-59, 60-69, 70-79, and so on.
Step 3: Enter the formula: In a range of cells, enter the FREQUENCY function. Select a range of cells that includes one additional cell than the number of bins you defined. For example, if you have four bins, select a range of five cells. Enter the FREQUENCY formula using the data array and the bins array. For example, if your data is in column A and the bins are in column B, you would use the formula
Step 4: Press Ctrl+Shift+Enter: Since the FREQUENCY function returns an array of values, you need to enter it as an array formula. After entering the formula, press Ctrl+Shift+Enter instead of just pressing Enter. Excel will populate the selected range with the frequency values.
The resulting array will contain the frequencies of values falling within each bin. The first value in the array represents the number of values that fall within the first bin, the second value represents the number of values in the second bin, and so on.


