COVARIANCE Function in Excel: Explained
In this article, you will learn how to use the COVARIANCE formula in Excel.
What does the COVARIANCE formula do in Excel?
In Excel, the COVARIANCE.P and COVARIANCE.S functions are used to calculate the covariance between two sets of data. The covariance measures the relationship between two variables and indicates how they vary together. The COVARIANCE.P function calculates the covariance for a population, while the COVARIANCE.S function calculates the covariance for a sample.
What are some uses of the COVARIANCE function in Excel?
The COVARIANCE.P and COVARIANCE.S formulas in Excel are useful for analyzing the relationship between two sets of data and understanding how they vary together. Here are some common uses of these formulas:
- Investment analysis & portfolio diversification: Covariance is used to measure the relationship between the returns of different investments. It is essential in portfolio management to assess the diversification benefits of different assets. By analyzing the covariances between various assets in a portfolio, you can determine how their returns tend to move in relation to each other. A lower covariance between assets indicates a potential diversification benefit, as they may not move in perfect sync.
- Risk assessment: Covariance is used to estimate the risk of a portfolio or investment. Higher covariance indicates a stronger relationship between assets, which means that if one asset experiences a large change in value, the other is likely to be affected as well. By understanding the covariance, you can evaluate the potential volatility and downside risk of an investment or portfolio.
- Statistical analysis: Covariance is a fundamental measure in statistics. It helps determine the degree to which two variables are linearly related. Covariance is used in regression analysis, where it quantifies the relationship between the independent variable(s) and the dependent variable. It can also be used in various research fields and data analysis scenarios. It allows researchers and analysts to explore the relationship and dependencies between different variables, such as sales and marketing expenses, temperature and ice cream sales, or customer satisfaction and product ratings.
By utilizing the COVARIANCE.P and COVARIANCE.S formulas in Excel, you can calculate and leverage covariance to gain insights into the relationships and dependencies within your data sets, helping you make informed decisions and draw meaningful conclusions.
How to use the COVARIANCE function in Excel?
The syntax of the COVARIANCE function in Excel is as follows:
This function returns the covariance of two arrays representing a population.
This function returns the covariance of two arrays representing a sample.
"array1" and "array2" represent the ranges or arrays of values for the two sets of data for which you want to calculate the covariance.
Here's how you can use these functions in Excel:
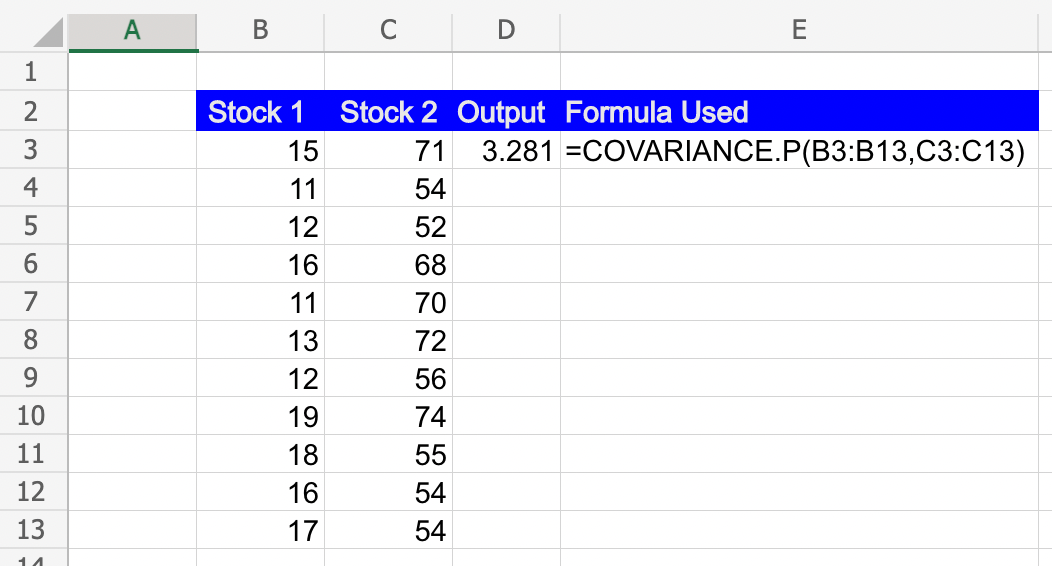
Step 1: Select a cell where you want the result to appear. Type either COVARIANCE.P or COVARIANCE.S followed by an opening parenthesis "(".
Step 2: Enter the range or array of values for the first and the second set of data, separated by commas. Close the parenthesis ")".
Step 3: Press Enter to get the result.