CORREL Function in Excel: Explained
In this article, you will learn how to use the CORREL formula in Excel.
What does the CORREL formula do in Excel?
The CORREL function in Excel is used to calculate the correlation coefficient between two sets of data. The correlation coefficient measures the strength and direction of the linear relationship between two variables. The correlation coefficient ranges from -1 to 1:
A value of 1 indicates a perfect positive correlation, meaning the variables move in the same direction.
A value of -1 indicates a perfect negative correlation, meaning the variables move in opposite directions.
A value close to 0 indicates a weak or no correlation, meaning there is no linear relationship between the variables.
What are some uses of the CORREL function in Excel?
The CORREL function in Excel has several practical uses. Here are a few examples:
- Portfolio Management: In portfolio management, the CORREL function is often used to evaluate the correlation between different investments. By analyzing the correlation coefficients between assets or asset classes, investors can build diversified portfolios that reduce overall risk. Assets with low or negative correlation tend to move independently, providing better risk mitigation.
- Forecasting and Prediction: The CORREL function can assist in forecasting and prediction by identifying relationships between variables. By calculating correlations between historical data, you can make predictions about future outcomes. For example, you can analyze the correlation between sales and various factors like advertising expenditure, economic indicators, or seasonal trends to forecast future sales figures.
- Risk Analysis: The CORREL function is helpful in risk analysis and risk management. By analyzing correlations between variables, such as market indices or asset returns, you can assess the level of systematic risk within a portfolio. Understanding the correlations between investments allows you to identify potential vulnerabilities and make informed decisions to mitigate risk.
- Data Validation: The CORREL function can be used as a data validation tool. It helps to ensure data integrity by checking for errors or inconsistencies in datasets. If the correlation coefficient falls outside a specific range, it may indicate data entry errors, outliers, or missing values that need further investigation.
These are just a few examples of how the CORREL function can be utilized in Excel. It provides valuable insights into the relationship between variables, allowing for informed decision-making, risk assessment, and data analysis in various fields.
How to use the CORREL function in Excel?
The syntax of the CORREL function in Excel is as follows:
"Array1" is the first set of data values.
"Array2" is the second set of data values.
Here's how you can use the CORREL function in Excel:
- Prepare your data: Arrange your data in two columns or arrays, with each column representing a different variable or dataset. Make sure that the number of data points in both arrays is the same.
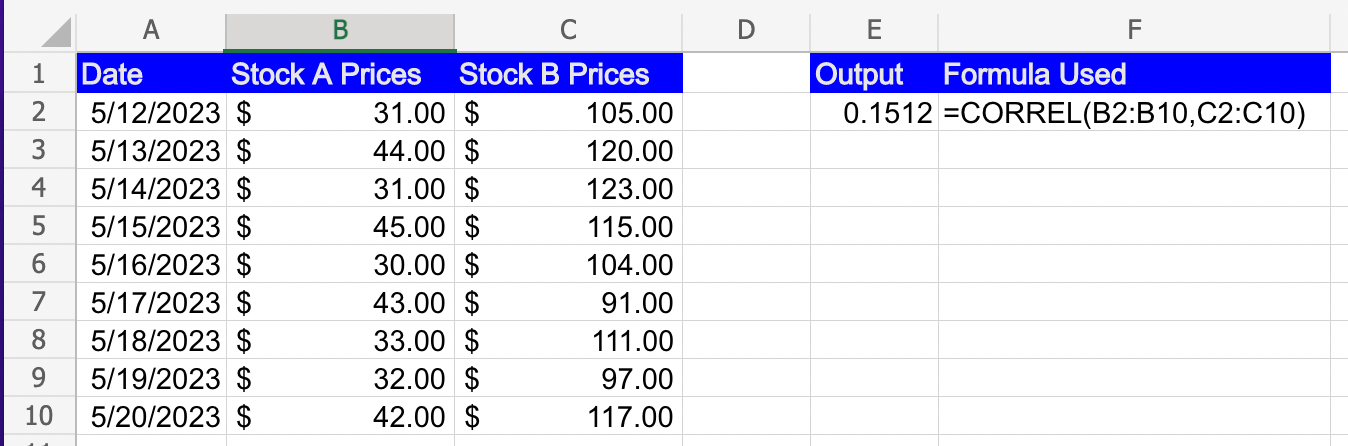
- Enter the formula: In a cell where you want to display the correlation coefficient, enter the CORREL function with the appropriate arrays as arguments. For example, if your data is in columns A and B, you would use the formula "=CORREL(A1:A10, B1:B10)".
- Press Enter: Once you have entered the formula, press Enter. Excel will calculate the correlation coefficient between the two datasets and display the result in the cell.