Premium Template
Restaurant 4-4-5 P&L Template for Google Sheets & Excel
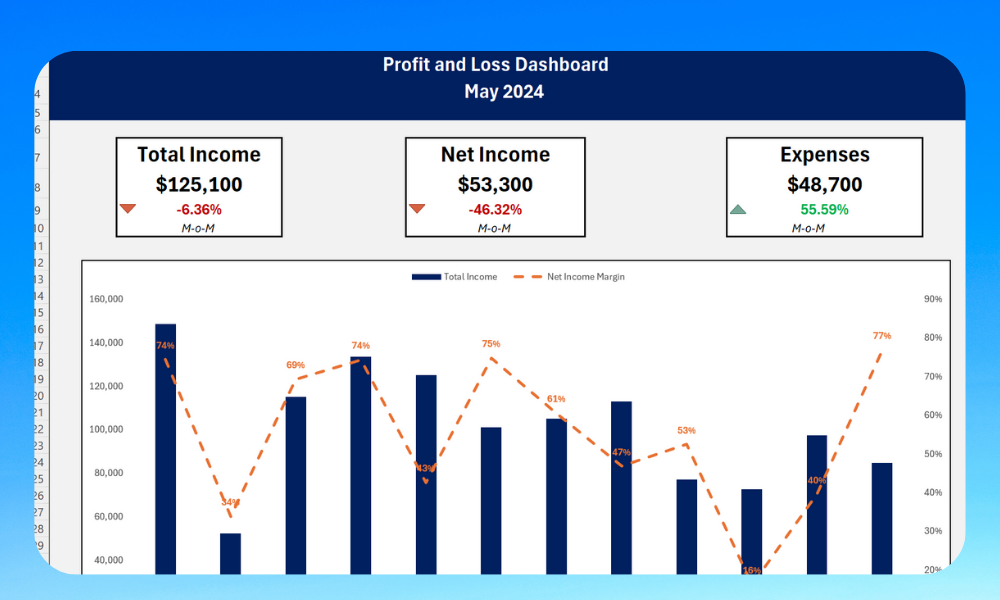
Get a live overview of your Profit & Loss and compare how you are growing every week with our built in 4-4-5 comparison model.
Compatible with

Excel

Google Sheets
Integrations

QuickBooks
Xero
Live Data

LiveFlow
What are premium templates?
Premium Templates are advanced solutions for complex financial reporting tasks. Unlock a template for a one-time fee, which includes unlimited access and full support for template implementation. Book a demo above to learn more.
Template Description
Who can this template help?
Key features
- Customized for restaurants, aligning profit and loss reporting with the 4-4-5 accounting calendar
- Supports accurate financial management and reporting in the unique restaurant operating environment
- Enhances decision-making with tailored financial insights and performance analysis
Use cases
Learn how to set up this template with this video
Get started in 3 simple steps
Want some help getting the template up and running?
Book a demo


Give the template superpower with live data from LiveFlow
Frequently Asked Questions
Simply click or tap the "Get the template now" button at the top of this page and fill out the form to gain access to this spreadsheet template.
These templates are compatible with both Google Sheets and Microsoft Excel. No specific version of Excel is required, but using a recent version is generally recommended for the best experience and full feature support.
By default, you will need to export your QuickBooks Online data into this spreadsheet template manually.
However, if you would like to sync your QuickBooks Online data to this spreadsheet and create a live, impactful dashboard that you can share with clients or stakeholders in just minutes, schedule a walkthrough of the LiveFlow platform with a member of our team. We can help you breeze through your reporting in record time.
LiveFlow has a comprehensive set of Google Sheets, Microsoft Excel, and QuickBooks Online articles that can help you upgrade your spreadsheet skills.
If you want to go the extra mile, we have a free certificate course called LiveFlow Academy aimed at improving your spreadsheet skills from basic to advanced.
Frequently Asked Questions
Premium templates are available at a one-time fee. Choose a premium template and book a demo to learn more.
The template is created by LiveFlow - LiveFlow is a software platform that helps businesses to automate financial workflows and manage their finances with ease.
You will gain unlimited access to a premium template without any time restrictions.
Yes! You can book a call with us for implementation support or email us if you need help.
Supercharge your consolidated reporting today