%20(4).png)


Checking your financial performance is critical, no matter how big or small your business is. Thankfully, the QuickBooks Online dashboard has everything you need to monitor company health and stay on top of accounting performance at any given moment.
Best of all, the dashboard can be customized and improved with powerful tools and add-ons.
Read on to learn more about what the dashboard is and how it can help optimize your QuickBooks experience.
QuickBooks Online Dashboard: The Basics
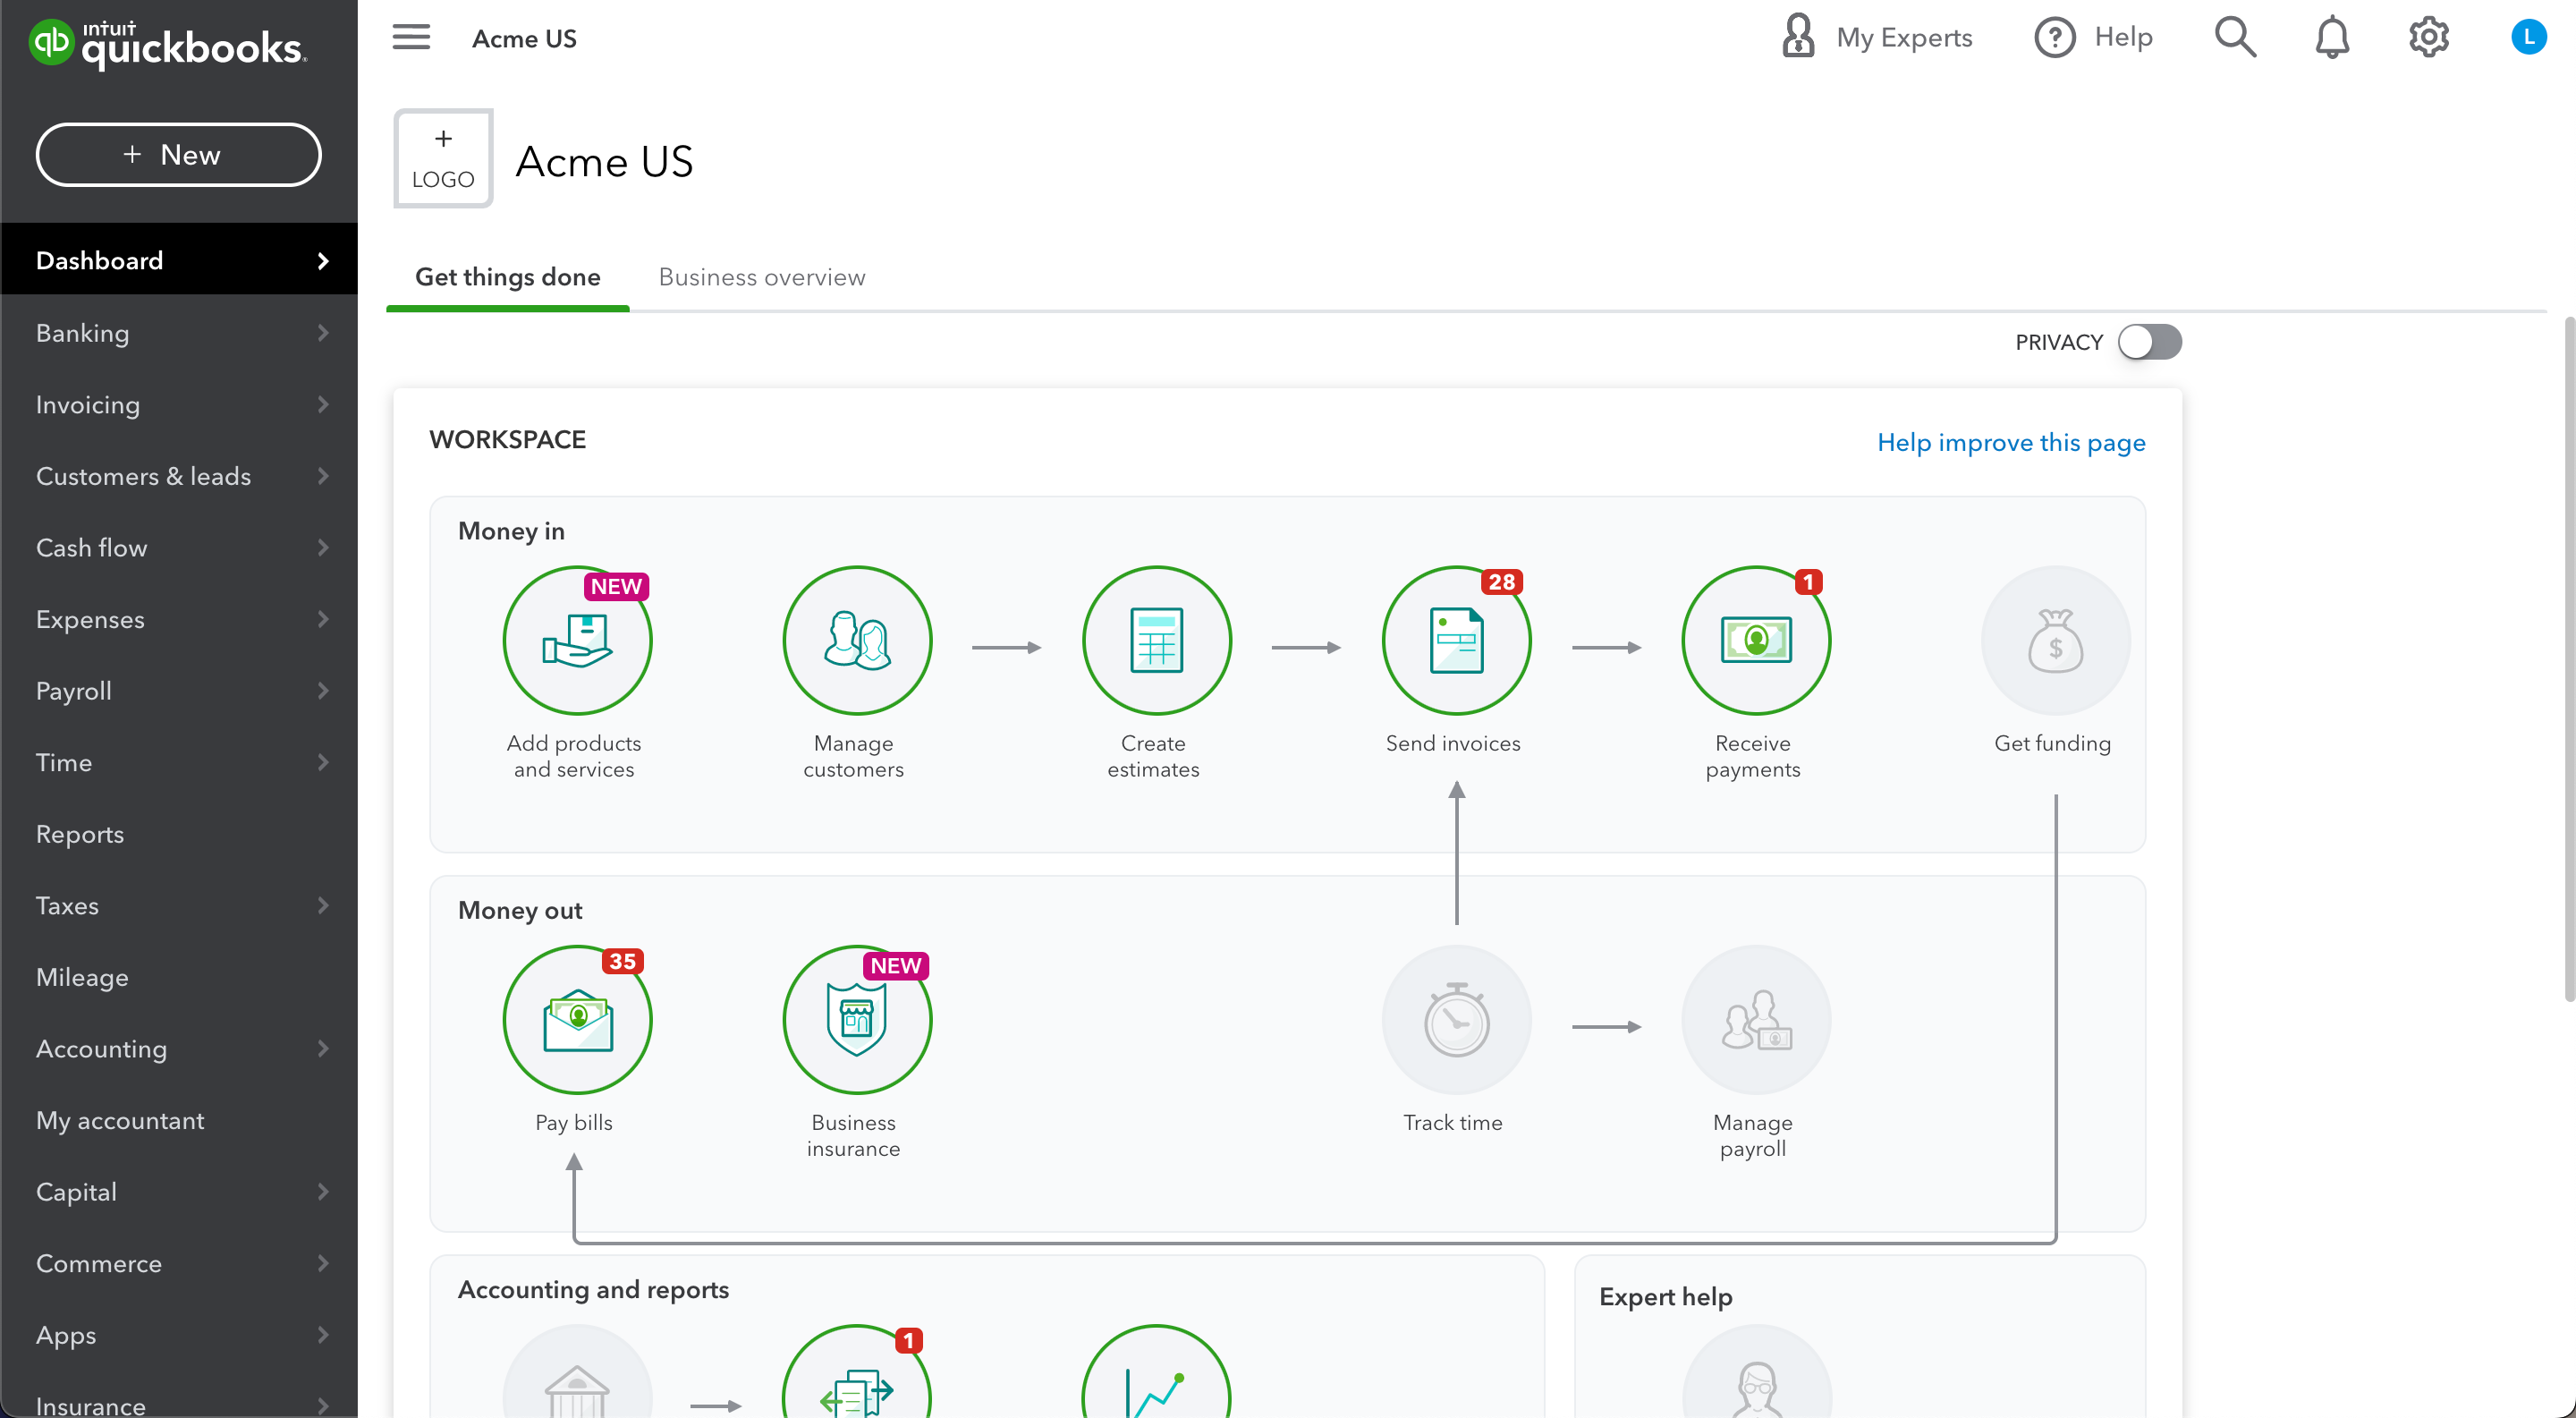
The QuickBooks Online dashboard is your one-stop shop for checking the health of your company and staying on top of accounting performance. It’s also a great place to get started with tasks like setting up new company records for vendors, customers, and employees, or uploading inventory.
The dashboard streamlines lots of common tasks into one location, so you don't have to dig around in tabs every time you want to perform a common task.
What Tabs Are on the Dashboard?
There are nine main tabs in the QuickBooks Online Dashboard: Banking, Sales, Expenses, Projects, Workers, Reports, Taxes, Analytics, and Accounting. In addition to the tabs, the dashboard also lets you search your financial records and adjust your QuickBooks settings.
Let's go over what each tab is used for in the QuickBooks Dashboard.
Banking
The Banking tab provides an overview of account balances, charges for your company, and provides links you can use to log into your bank accounts directly from the dashboard. You can also use the Banking tab to record deposits and transfers into your company account from other companies or individuals.
The Banking tab is also where you can set up and manage automatic payments. This is especially handy for bills like insurance and utilities, which may vary slightly from month to month and get confusing when you are manually tracking expenses. Automatic payments are a great way to take the guesswork out of your accounting, so you can keep your finances running smoothly without having to remember to pay every bill.
Sales
The Sales tab is where you can track sales and log sales payments and credits. If you use the QuickBooks Sales feature, you can also schedule appointments and forecast sales and revenue. The Sales tab also has links to help you find customers, add new customers and manage inventory items.
If you use Sales orders in QuickBooks, you can also view open orders and their statuses, view invoices related to open orders, and view credit memos associated with open orders. This can help you stay on top of which customers owe you money and which ones you owe.
Expenses
The Expenses tab is where you can record all of your business-related expenses and find details about each transaction. You can enter expenses manually or import them from your bank account or credit card, or you can use QuickBooks Payments to bill customers for services or products you have already delivered.
You can also use the Expenses tab to create expense categories for tracking and reporting. If your company is set up for QuickBooks Multi-Company accounting, you can share expense categories with other companies in your account. This can be helpful if you have common expenses like office supplies or utilities.
Projects
The Projects tab is a great place to log all of the money you spend on projects and tasks and the time your company spends working on those projects. This can help you find areas where you may be overspending or discover projects that eat up lots of employee time.
You can also use the Projects tab to assign project-related expenses to specific projects, which can be helpful if you have employees and want to track project-related expenses by person. You can also use the Projects tab to create a project budget, which can be helpful if you are on a tight timeline and need to know how much money you have left to spend.
Workers
The Workers tab is where you can log your payroll, including employees and contractors. You can also use the Workers tab to track time and work hours, create 1099 forms for employees or contractors, enter or edit payroll information, and track worker expenses.
If you use QuickBooks Payroll, you can also use the Workers tab to calculate your payroll taxes and manage deductions.
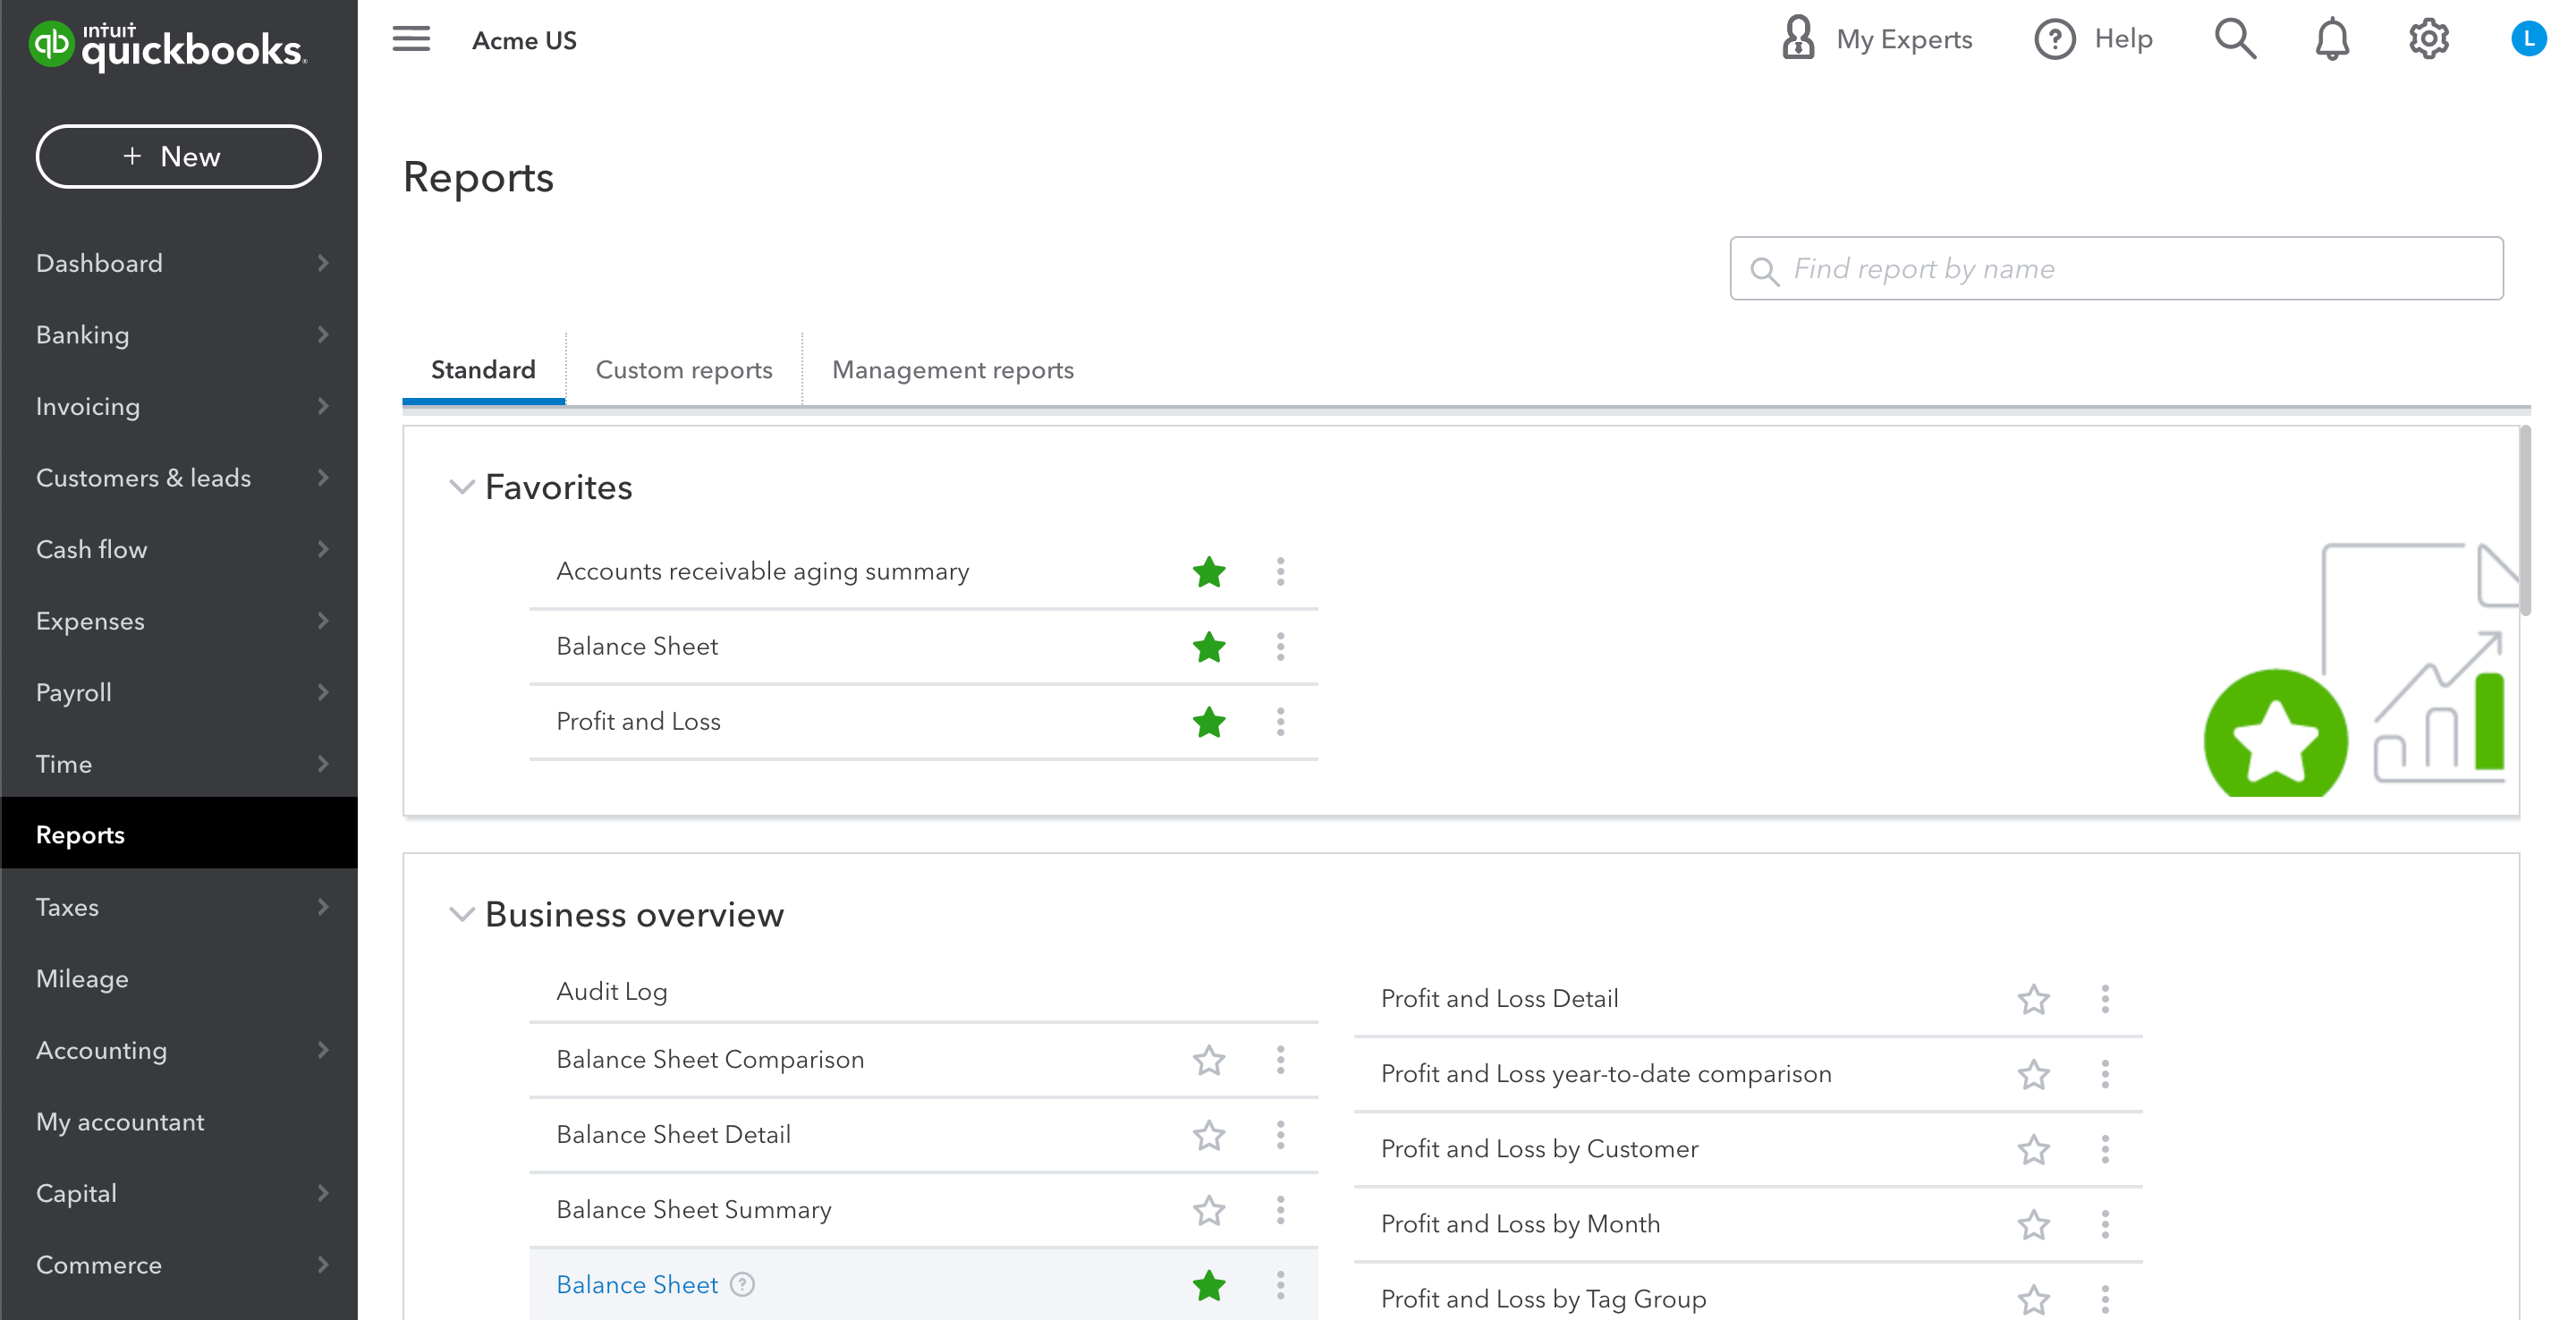
Reports
The Reports tab is where you can find data about your company’s financial health and performance and see trends over time. You can also use the Reports tab to create customized reports based on the data you want to examine.
If you use QuickBooks Multi-Company accounting, you can also use the Reports tab to view data from other companies in your account. This can be helpful if you want a quick snapshot of how your entire business is doing or want to compare your data to other businesses in your company.
Taxes
The Taxes tab is where you can find tax information, like estimated tax payments, and track expenses that are tax deductible. You can also use the Taxes tab to create tax estimates, import data from your accounting software, or find tax information for employees.
Once your tax return is ready to be filed, you can even submit your company’s taxes directly to the IRS from within QuickBooks.
Analytics
The Analytics tab is where you can find information about your company’s financial health and performance. You can also use the Analytics tab to create customized financial metrics and graphs based on the data you want to examine.
The Analytics tab is especially useful if you want to track things like cash flow, profit and loss, or sales over time and see how those metrics change. This can help you see where you are spending too much money and find ways to cut costs or increase revenue.
Accounting
The Accounting tab is where you can access your general accounting settings, like currency and payment terms. You can also use the accounting tab to find information about your company’s financial health and performance.
The Accounting tab is also where you can find and edit general account settings, like your company name and address, banking information, tax information, and payment terms. This can be helpful if you want to change your account settings at any point during the year or if your company changes its name or address.
QuickBooks Dashboard Analytics Explained In-Depth
The analytics section of the dashboard is a new addition to the QuickBooks Online dashboard. This is a powerful section that will help you track and understand key metrics for your business.
You can track a number of different data points, including top products, top vendors, top customers, top locations, top marketing channels, and more. These stats can be helpful when you're trying to understand your business and make strategic decisions.
For example, if you’re trying to figure out which products are most popular, you can check the analytics section of the dashboard. You can also see data on your top customers, top locations, and top marketing channels to get a complete picture of your business performance.
All of this information is easy to understand because you can generate helpful visuals such as graphs and charts directly from the analytics section of the QuickBooks dashboard.
Improve your QuickBooks Dashboard with Powerful Tools like LiveFlow
One of the best new features of the QuickBooks Online Dashboard is the ability to install custom products that make the software more intuitive and easier to use. One of the best platforms for QuicBooks Online is LiveFlow, which allows you to automate many of the most complex accounting processes.
LiveFlow features helpful templates that can save you a ton of time in QuickBooks. This can help you streamline your most common and important bookkeeping processes.
Additionally, LiveFlow is a valuable platform built for QuickBooks that is designed to make it easy to create an integrated, real time connection between your QuickBooks data, customized reports and dashboards in Google Sheets. This means that you don’t have to give anyone access to QuickBooks simply to review reports – you can use pre-built templates or bring live data to any customized report you already have. This way, you only share what departments need to see.
The live connection between QuickBooks and Google Sheets means that your reports will always be up to date – without any manual exports, data formatting or hands-on effort.
Conclusion
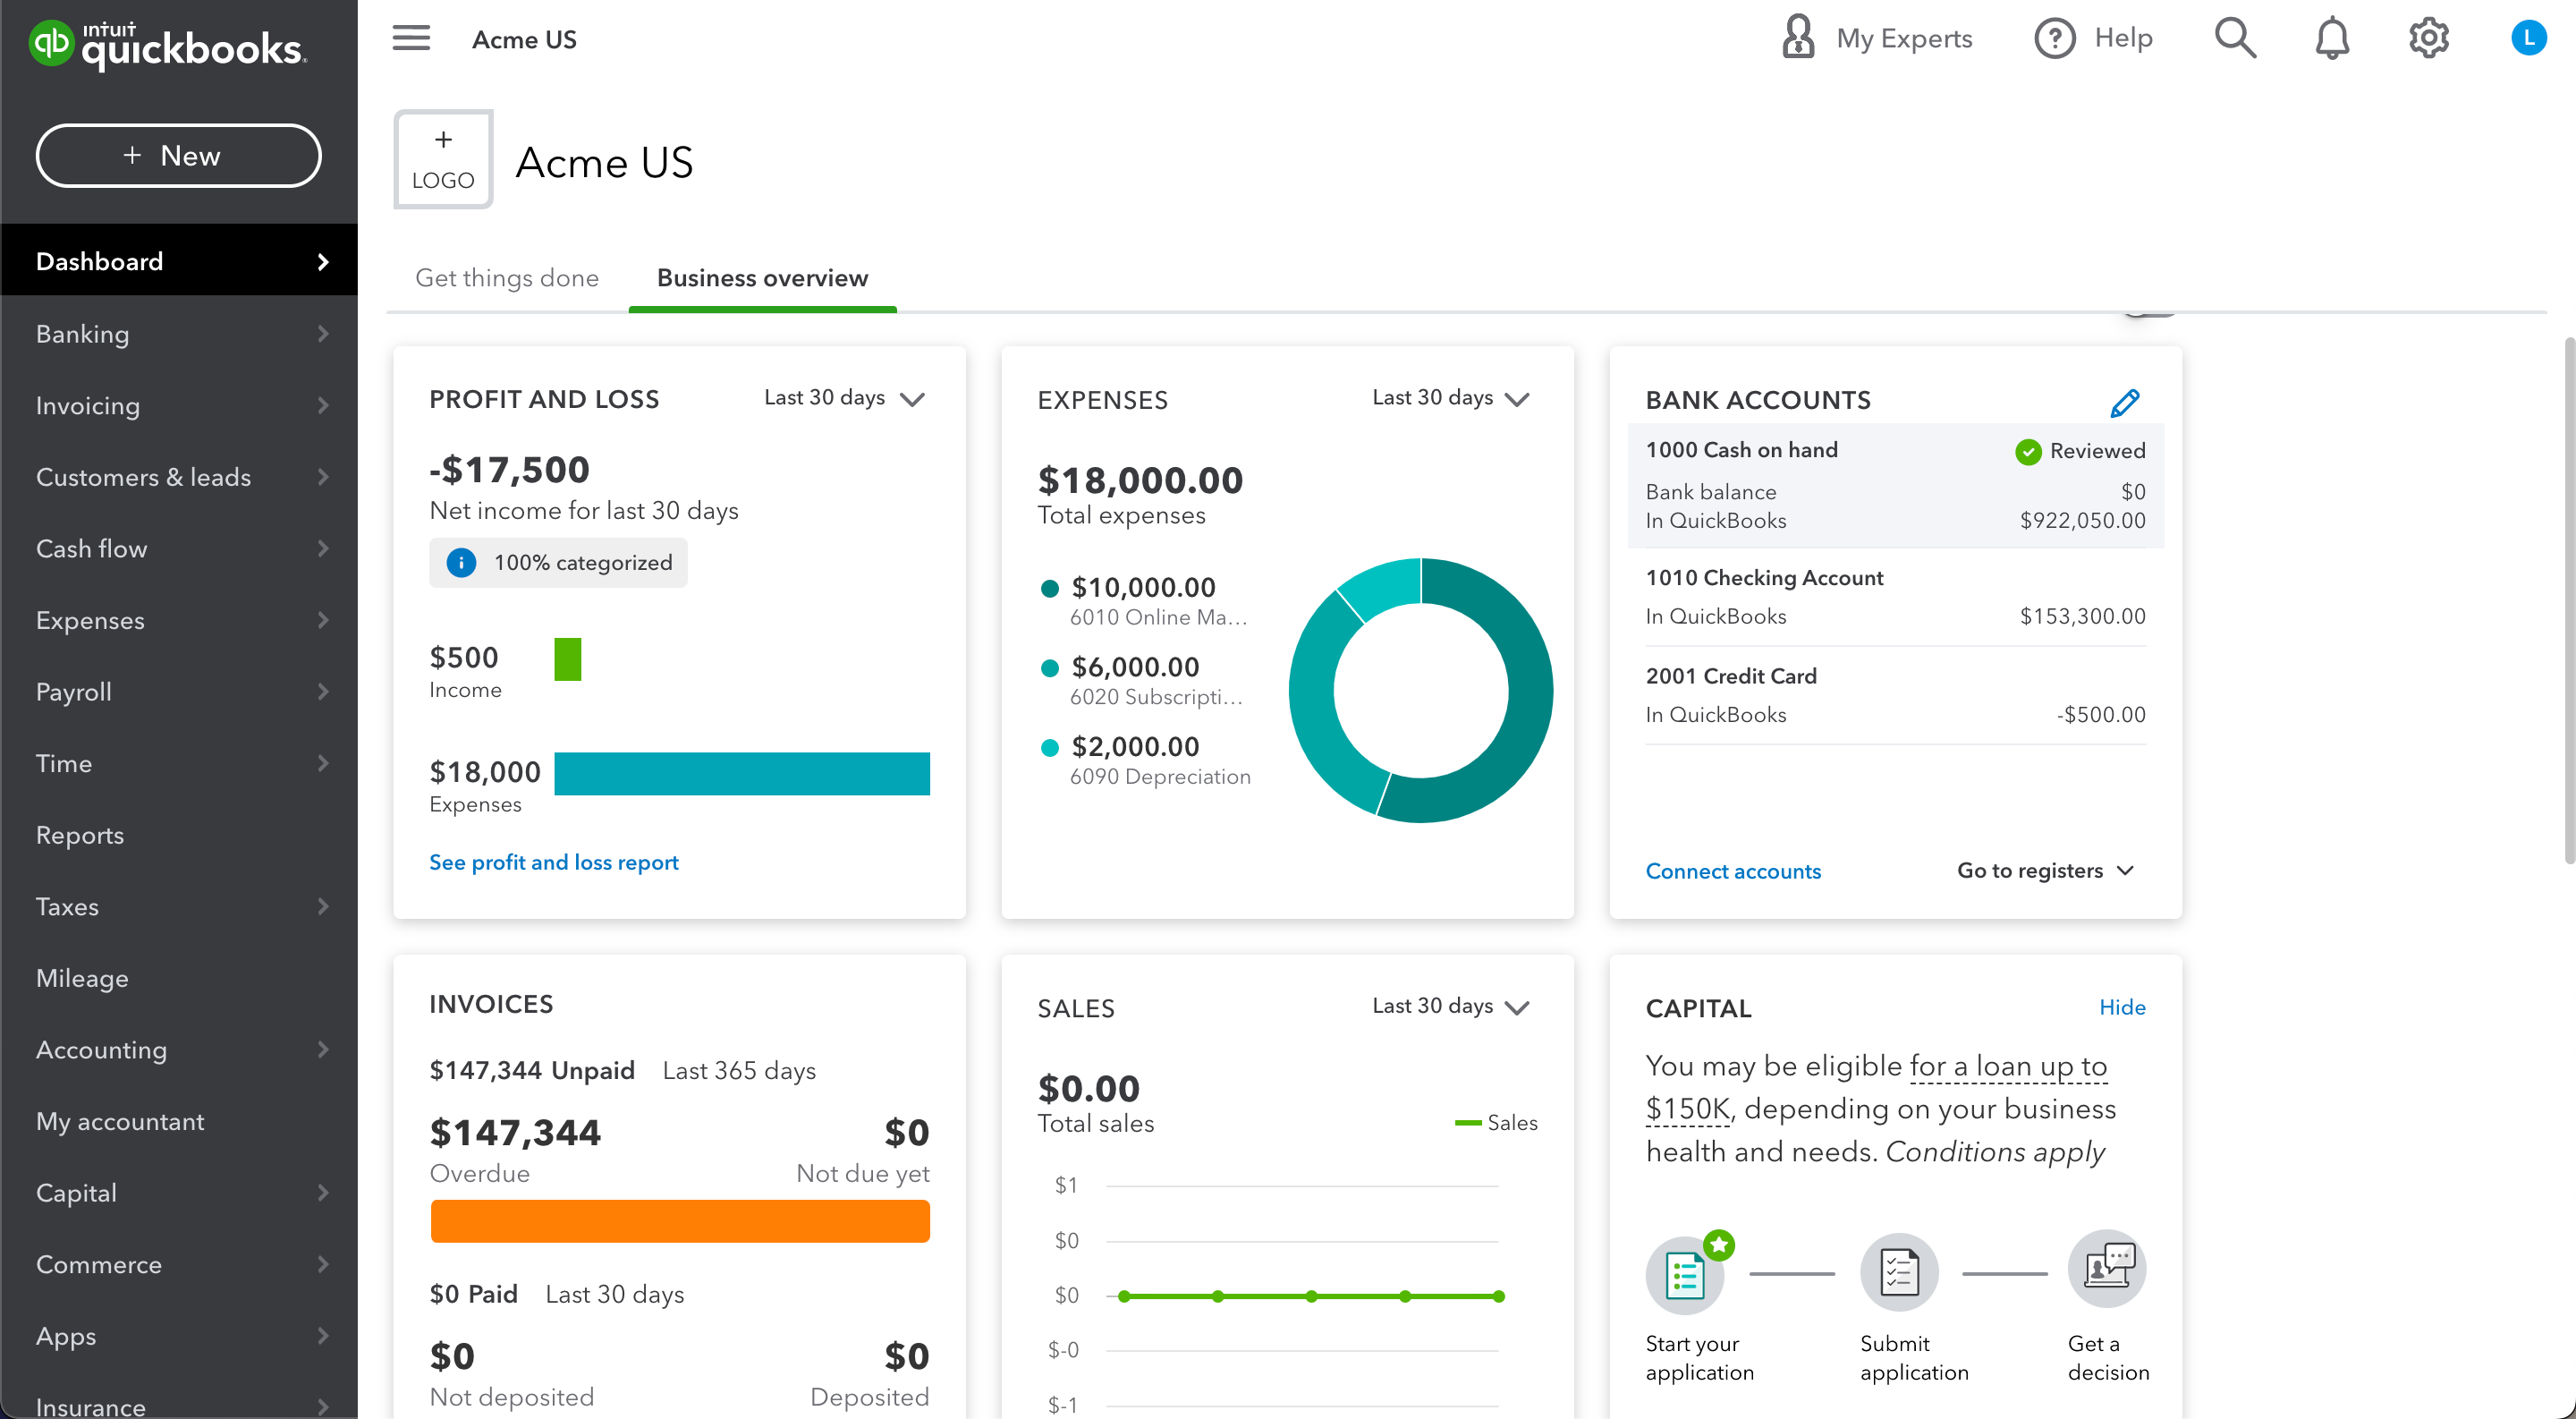
The QuickBooks dashboard gives you real-time information about your company’s financial performance. From this page, you can see key metrics like revenue, profit, expenses, and cash flow. You can also view your earnings report, and your AR and AP reports for a complete picture of your overall financials.
The dashboard also has an analytics section that allows you to track key metrics for your business. These metrics can be helpful when you’re trying to make strategic decisions about your company. Best of all, you can customize the dashboard however you want by adding powerful accounting tools like the LiveFlow platform, which can make your entire accounting workflow much easier.
If you want to optimize your QuickBooks experience, then be sure to check out LiveFlow. You can try LiveFlow risk-free and explore all of its great features with a 30-minute demo.