
How to Find Line of Best Fit in Google Sheets
The line of best fit can be a powerful tool in data analysis and statistics in your Google Sheets workbook.
This article will explain how to find the line of best fit and discuss different scenarios where this could be a useful tool for your accounting and finance needs.
What is a Line of Best Fit?
The line of best fit, also known as the trend line, is a straight line that represents the best approximation of the relationship between two variables in a scatter plot.
This line can be useful in modeling relationships and predicting future trends. You can insert one into your Google Sheets scatter plot in just a few steps.
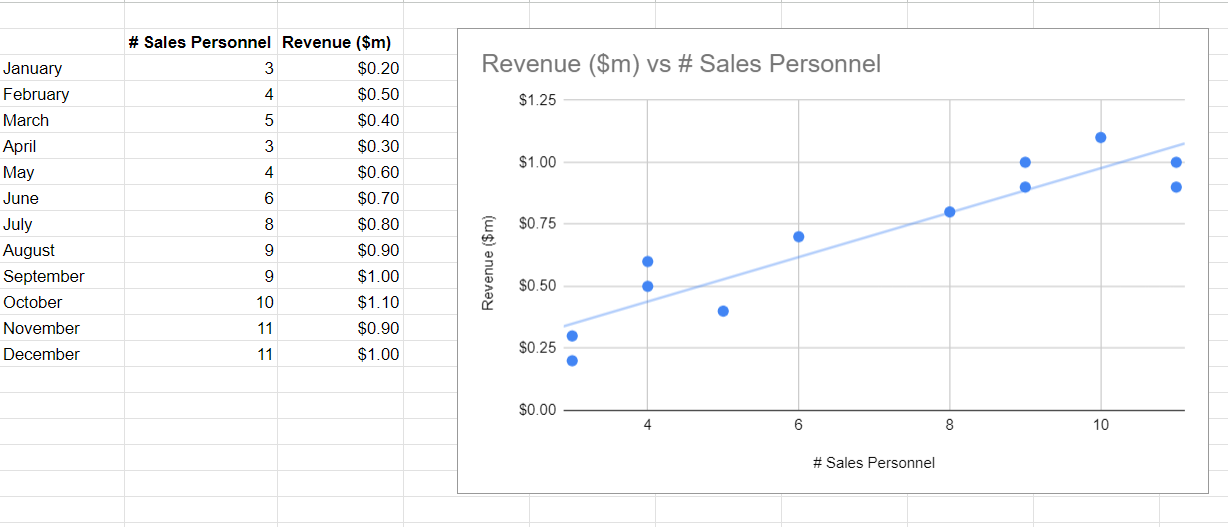
We will begin this guide by creating a scatter plot chart. If your scatter chart is already completed, skip ahead to step 3 to insert the line of best fit.
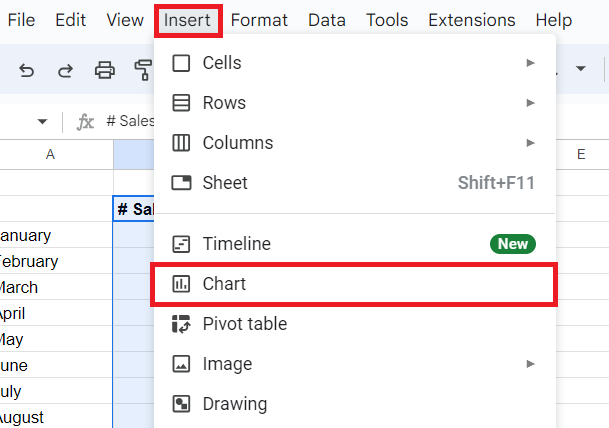
- The first step is to highlight the data you wish to display on your scatter plot chart, and select “Insert” from the toolbar, then “Chart” from the drop-down menu.
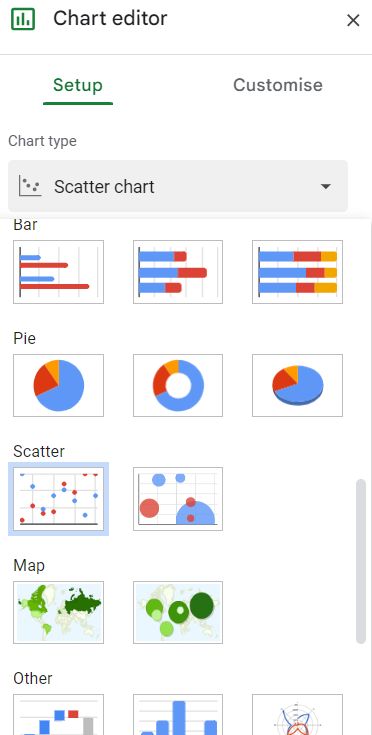
- The Chart Editor screen will appear. From here, click on “Chart type” and scroll until you find your desired scatter plot chart.
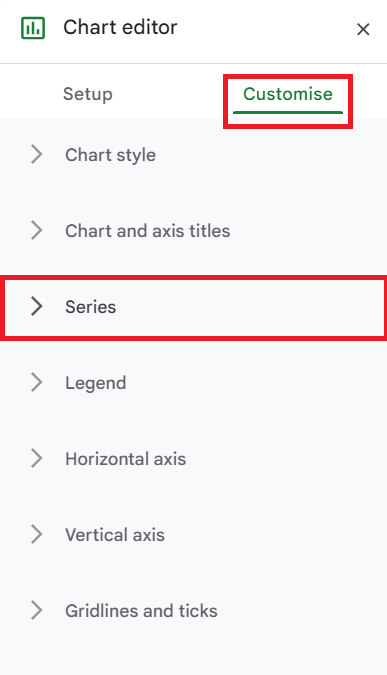
- You will now have your scatter chart. To add your line of best fit, once again we will need to be in Chart Editor. To do this, select the three dots in the upper right corner of the scatter plot. In Chart Editor, you will select “Customize” and then “Series”.
- From the series tab, we will scroll to the bottom and select the “Trend line” check box. This will add our line of best fit and allow for any customization you desire to enhance visualization.
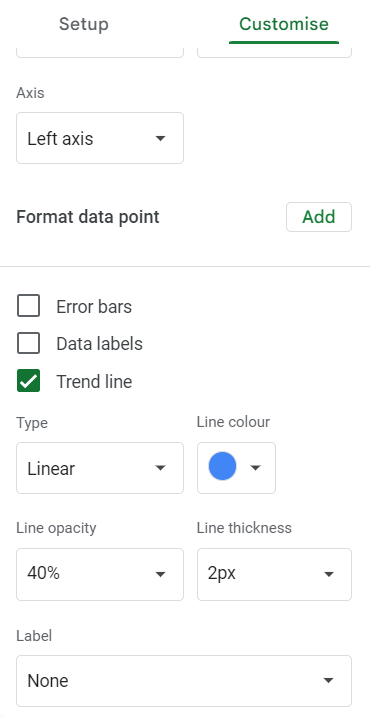
- You now have your line of best fit on your scatter plot.
Additional Google Sheets Tips and Tricks
Are you learning this formula to visualize financial data, build a financial model, or conduct financial analysis? In that case, LiveFlow may help you automate manual workflows, update numbers in real-time, and save time.
You can access various financial templates on our website, from the simple Income Statement to Multi-Currency Consolidated Financial Statement. To learn more about all LiveFlow has to offer, book a demo.