Turn Google Sheets into a live FP&A dashboard
Turn Excel into a live FP&A dashboard
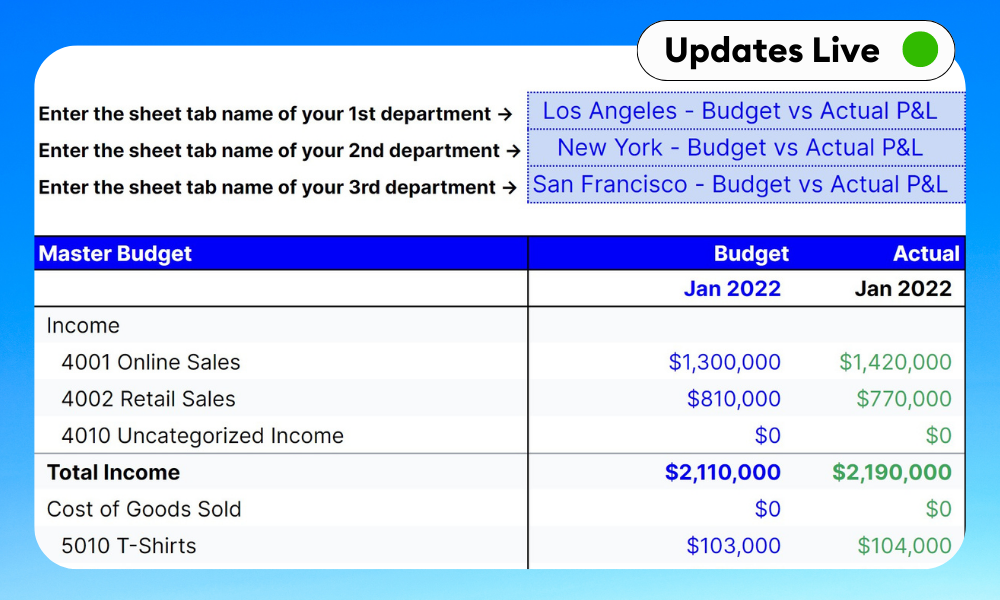
Consolidate multiple entities in 3 minutes
Know a vendor we should add to our partner directory? Email us at founders@liveflow.io


%20(1).png)
.png)

.png)


.png)


.png)
.png)


.png)
.png)


.png)


.png)


.png)
.png)
.png)


.png)
.png)


.png)