
NPV Function in Google Sheets: Explained
In this article, you will learn how to use the NPV formula in Google Sheets.
What does the NPV function do?
The NPV (Net Present Value) function in Google Sheets calculates the net present value of a series of cash flows based on a specified discount rate. This function is helpful in evaluating the potential profitability of an investment or project.
The net present value is a measure of the value of future cash flows, discounted to the present time. It takes into account the time value of money, which means that a dollar received in the future is worth less than a dollar received today. The discount rate is used to calculate the present value of each cash flow, and the net present value is the sum of all present values.
The NPV function is commonly used in financial analysis and decision-making to help determine investment projects' feasibility and potential profitability. It is also often used in capital budgeting to compare the relative value of different investment opportunities.
How to use the NPV formula in Google Sheets
The NPV function has the following syntax:
discount_rate: This is the rate of return used to discount the cash flows. It is expressed as a decimal value, such as 0.05 for 5%.
cash_flow1, cash_flow2, etc.: These are the individual cash flows to be included in the calculation. They can be positive (for inflows) or negative (for outflows).
Note: If you need to calculate the value of future cash flows that irregularly happen, use the XNPV function instead.
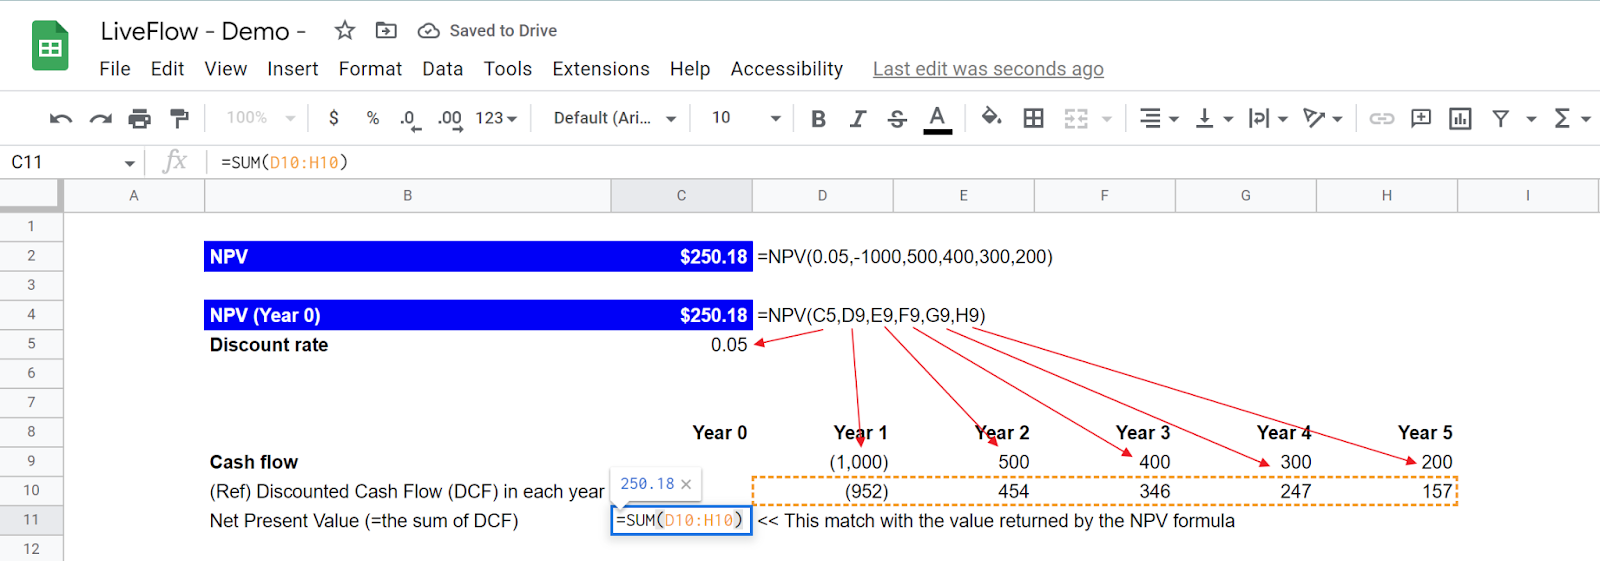
Here's an example of how the NPV function can be used:
In this example, the function calculates the net present value of a series of five cash flows, with a discount rate of 5%. The first cash flow is negative, representing an initial investment of $1000. The remaining four cash flows are positive, representing future returns on the investment.
The result of this function would be the net present value of the cash flows, based on the specified discount rate. This value can be positive (indicating a profitable investment) or negative (indicating a loss).
Also, you can use the returned value dynamic by using cell references in the formula. We show the example formula containing cell references in the following picture.
What is the difference between the NPV and XNPV formulas?
The main difference between the NPV and XNPV functions is that the XNPV function allows you to specify the dates of the cash flows, while the NPV function does not. This means that the XNPV function is more flexible and can be used in more situations than the NPV function.